Enhancing Business Decisions with Reporting Dashboards
Discover how reporting dashboards can transform your decision-making process and improve business outcomes.
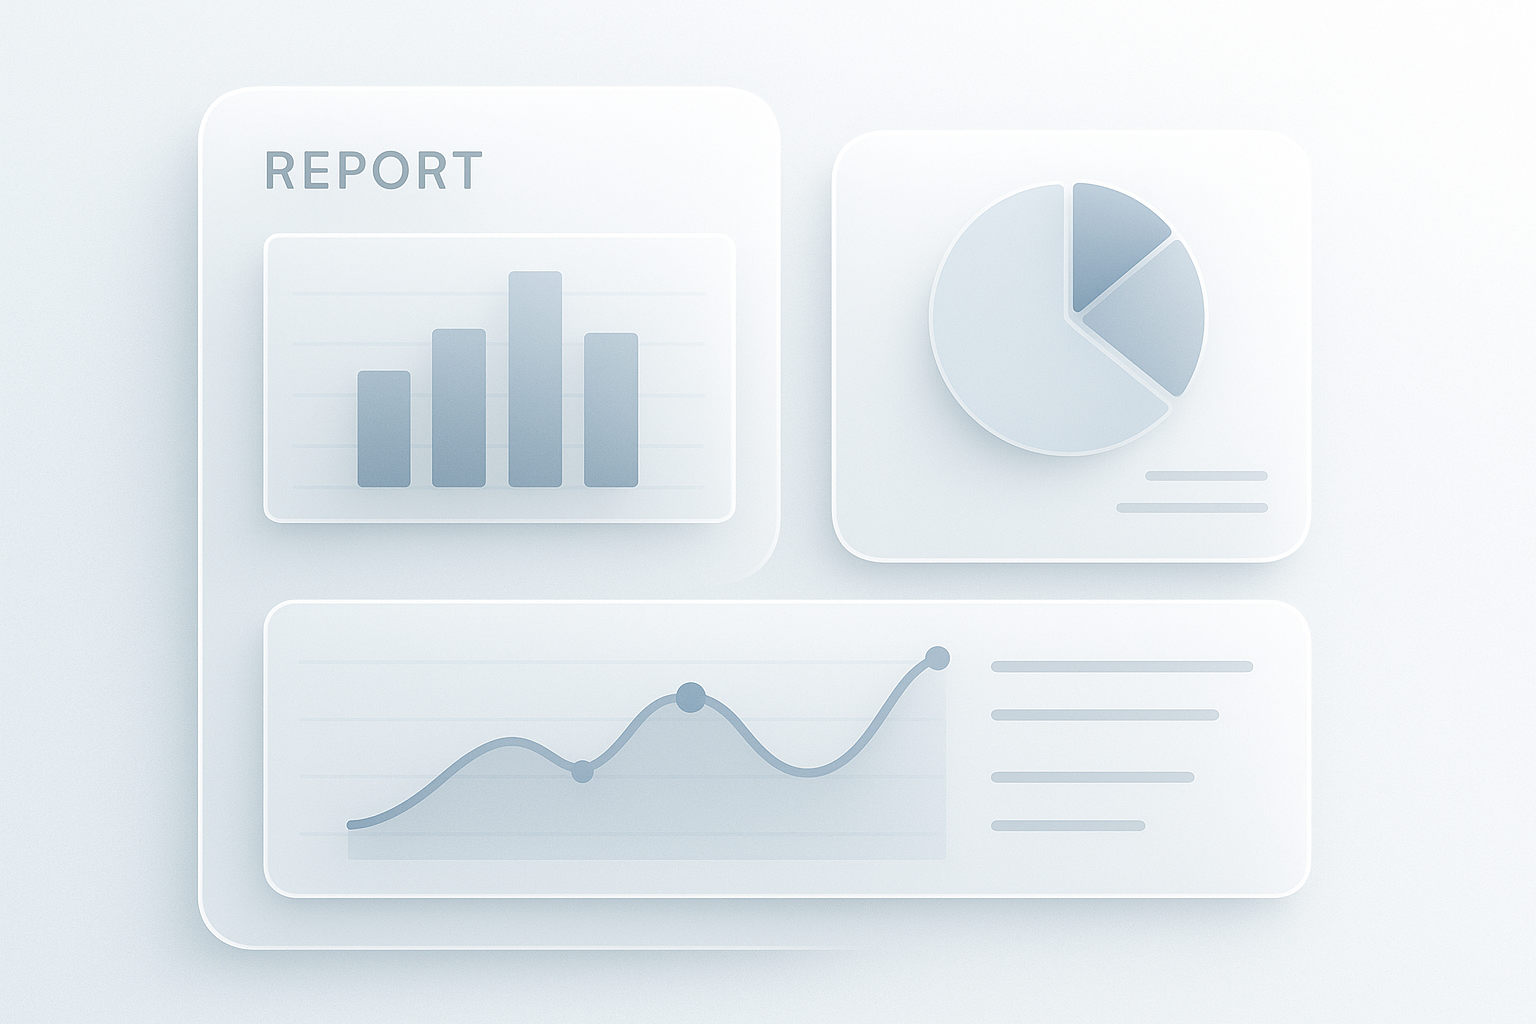
In today's data-driven landscape, organizations face the challenge of sifting through vast amounts of information to make informed decisions. Reporting dashboards play a crucial role in this process, enabling businesses to visualize key metrics and derive actionable insights. By integrating various data sources into a cohesive view, these tools empower decision-makers to navigate complexities and drive better outcomes.
The Importance of Reporting Dashboards
Reporting dashboards serve as centralized platforms to visualize data from multiple sources, providing businesses with a comprehensive overview of their operations. Here are several ways in which they can enhance decision-making:
1. Real-Time Data Access
One of the primary benefits of reporting dashboards is their ability to provide real-time data. This immediacy helps organizations react swiftly to changes in the market or operational challenges. Tools like Google Data Studio and Tableau can connect to live data sources, enabling stakeholders to monitor performance metrics on-the-fly.
2. Simplified Data Visualization
Data can be overwhelming, especially when presented in raw formats. Reporting dashboards transform complex datasets into intuitive visualizations, making it easier for teams to grasp trends and outliers. With platforms such as Microsoft Power BI and Looker, users can create custom graphs, charts, and heatmaps that highlight significant data points.
3. Improved Collaboration and Communication
Dashboards foster collaboration by providing a shared platform for stakeholders to discuss insights. When teams align around a common set of data, it streamlines communication and ensures everyone is on the same page. Tools like Notion or Airtable can integrate with reporting dashboards, allowing teams to comment on and annotate data collaboratively.
4. Data-Driven Strategy Formulation
Utilizing dashboards to track KPIs and metrics enables businesses to formulate strategies based on tangible data rather than intuition. For example, an e-commerce platform using WooCommerce can leverage dashboards to monitor sales trends, customer behavior, and inventory levels, allowing them to make data-informed decisions about marketing campaigns or stock replenishment.
5. Predictive Analysis Capabilities
Many modern reporting dashboards incorporate predictive analytics, providing insights that extend beyond historical data. By employing machine learning algorithms, these tools can forecast future trends, helping businesses anticipate market shifts and adjust strategies accordingly.
Key Features to Look for in Reporting Dashboards
When selecting a reporting dashboard for your business, consider the following features:
- Integration Capabilities: Ensure the dashboard can connect with your existing tools, such as CRM systems (like HubSpot) and e-commerce platforms.
- User-Friendly Interface: A clean, intuitive interface ensures that users of all technical levels can extract insights without extensive training.
- Customization Options: The ability to tailor dashboards to specific business needs enhances their relevance and effectiveness.
- Mobile Accessibility: In an increasingly mobile world, having a dashboard that is accessible on various devices can facilitate decision-making on the go.
Popular Reporting Dashboards for Businesses
Several reporting dashboard tools stand out for their features and capabilities:
- Google Data Studio: Offers extensive customization and integration with other Google services, making it a popular choice for businesses already using Google Analytics and Ads.
- Tableau: Known for its powerful data visualization capabilities and ability to handle large datasets, making it suitable for enterprises.
- Microsoft Power BI: Integrates seamlessly with the Microsoft ecosystem, providing robust analytics tools for businesses of all sizes.
- Domo: An all-in-one solution that combines data integration, visualization, and collaboration capabilities, ideal for fast-growing companies.
Closing Takeaway
Reporting dashboards are more than just visual tools; they are essential for driving informed business decisions. By leveraging real-time data, improved collaboration, and predictive analytics, organizations can better navigate challenges and capitalize on opportunities. Integrating the right reporting dashboard into your operational framework can transform how you view and utilize data, ultimately leading to enhanced decision-making and improved business outcomes.
Inspired by this post?
We'll suggest features tailored to this post.